.jpg)
Machine Learning approach on On-Time Performance of Flights
Done at SF, 2018
Aim
Flight delays are an unavoidable risk that every passenger might have to face. They lead to confusion and frustration, not to mention irreparable damages caused by missed deadlines in some cases. These risks can be prepared for by developing a reliable flight delay prediction model. Thus the losses incurred can be reduced or mitigated. The aim of the project is to model a two stage predictive machine learning engine to forecast the on-time performance of a flight from the considered datasets. The first stage is a classifier that determines whether a flight is delayed or not. The second stage is to use a regression algorithm to predict the amount of delay in minutes.
Code for the project is found here.
Data Collection and Overview
The data under consideration was obtained from the official website of Bureau of Transportation Statistics, United States Department of Transportation. Details of flights that flew between 15 different airports were isolated over a period of five years, that is, from 2013-2017. The airports considered were (airport codes):
- ATL
- CLT
- DEN
- DFW
- EWR
- IAH
- JFK
- LAS
- LAX
- MCO
- MIA
- ORD
- PHX
- SEA
- SFO
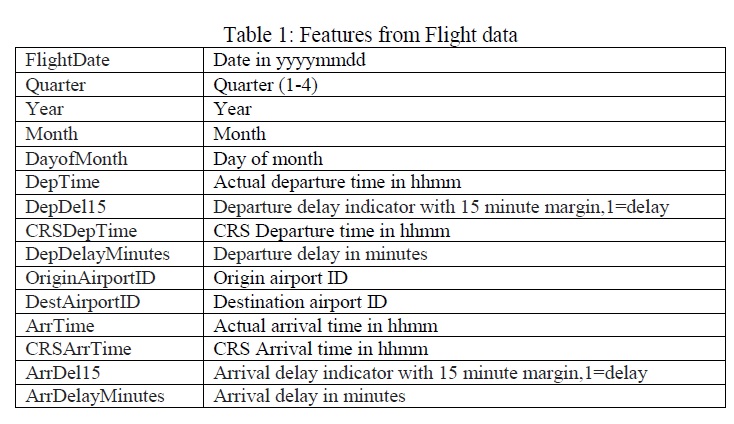
The features that were considered in the flight data are mentioned in Table 1.
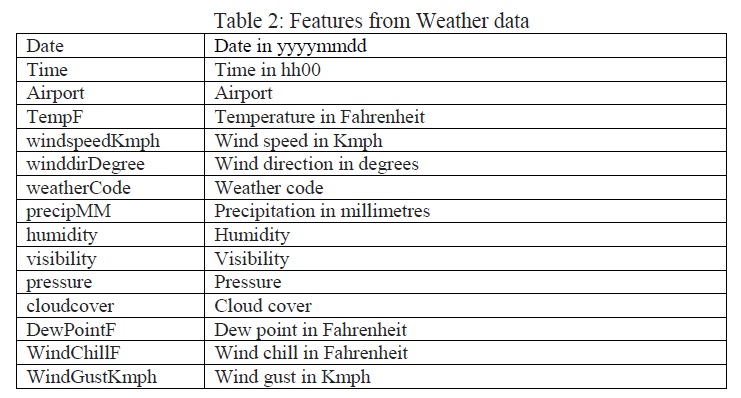
Separate weather datasets over the same time period and locations were also obtained. The weather dataset provided the weather details for every hour of every day over the time period. The weather features that were used for the purpose of this project are mentioned in Table 2.
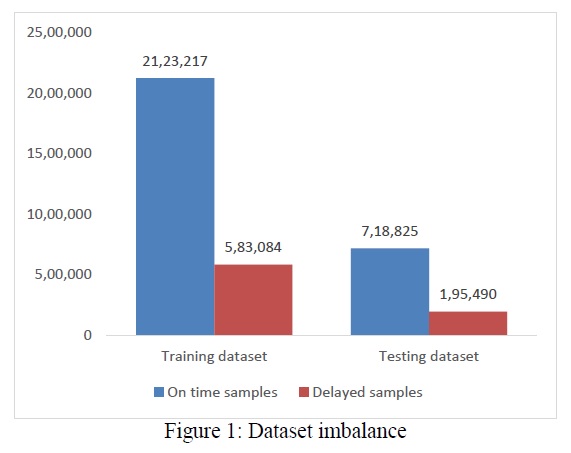
The weather and flight datasets were then appropriately merged on the basis of departure time and location. On observing the dataset furthermore, it was found that the number of on-time samples were much greater than the number of delayed samples as shown in Figure 1. This imbalance can cause a major impact while training the machine learning models. The different methods used to rectify this imbalance were under-sampling and over-sampling and it will be discussed the next sections.
Classification
Classification was performed on the dataset to determine if the flight is delayed or not with a 15 minute margin. Amongst the different classifier algorithms used, the three classifier algorithms that best fit our problem are namely: Random Forest, Gradient Boosting and Extra Trees and the results obtained can be seen in Table 4. As mentioned earlier, the dataset had an imbalance of minority and majority samples. This imbalance can cause a major impact while training the machine learning models. To combat this imbalance, different sampling methods are used. From the Tables 4, 5 and 6, it can be seen that the classification algorithm performs better after sampling methods are used.
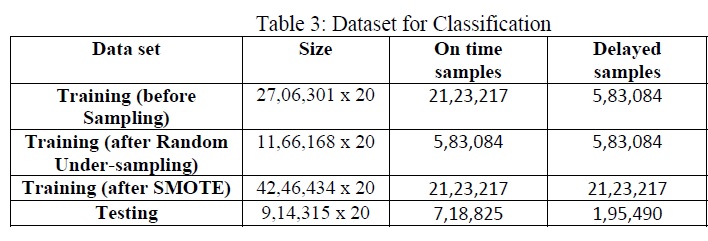
Oversampling and undersampling are the two types of sampling available. SMOTE (Synthetic Minority Over-Sampling Technique) and Random Undersampling were used in the project to rectify the imbalance present in the dataset. The dataset after the use of sampling methods is shown in Table 3.
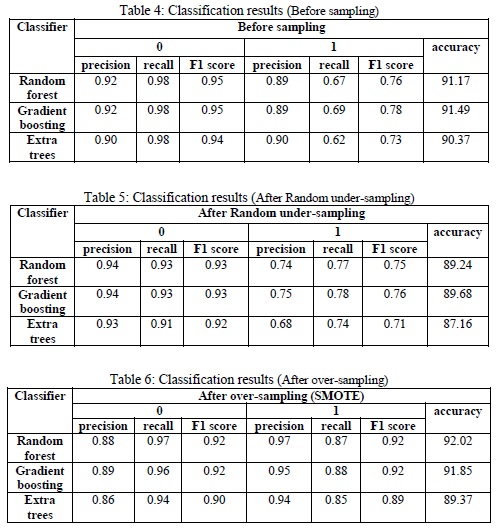
SMOTE outperformed Random Undersampling as seen in Tables 5 and 6. Random Forest and Gradient Boosting performed similarly after SMOTE. But considering the accuracy and time constraints, Random Forest algorithm performed best overall with 92.02% accuracy closely followed by Gradient Boosting algorithm with 91.85% accuracy.
Regression
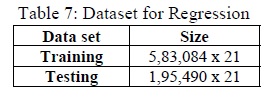
Regression was performed on the data having an arrival delay to predict the amount of delay in minutes in the test dataset as shown in Table 7. Amongst the different regression algorithms used, the three regression algorithms that best fit our problem were namely: Random Forest, Gradient Boosting and Extra Trees and the results obtained are tabulated in Table 8.
Hyper Parameter Tuning was carried out to improve the regression results on a trial and error basis. Grid search with cross validation was used to determine the best parameters. This evaluates all possible combinations of the parameters defined in the algorithm.
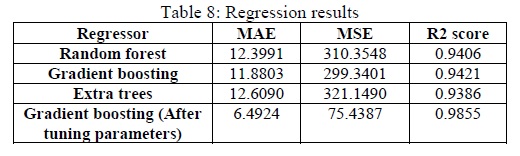
The best performing algorithm was found to be Gradient Boosting algorithm along with hyper tuned parameters with variance of 0.9855 and with a mean absolute error of approximately 6 minutes and a mean squared error of 75.4387 as mentioned in Table 8.
Conclusion
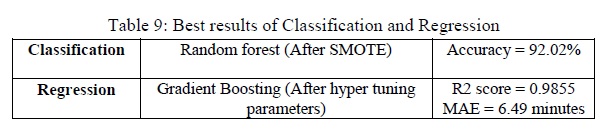
The best results in classification was obtained using Random forest algorithm along with SMOTE and it was Gradient Boosting along with hyper parameter tuning for regression as seen in Table 9. Gradient boosting and Random Forest had almost similar results in classification. However, taking the time consumed in mind, Random forest performed marginally better than Gradient Boosting algorithm. But, Gradient Boosting after hyper tuning parameters outperformed the other algorithms in regression.