.jpg)
Air Pollution based Routing Algorithm for VANETs
Done at National Conference on Information and Communication Technologies (NCICT), 2020
Marjerie S, Aditi Balgujar A, Muthukumaran A, Kishore R
Abstract
Vehicular Ad-Hoc Network (VANET) is a type of network that is created from the concept of establishing a network of cars for a specific need or situation. VANETs have now been established as reliable networks that vehicles use for communication purpose on highways or urban environments. The two most important aspects of VANETs are Vehicle to Vehicle communication (V2V) and Vehicle to Infrastructure communication (V2I), they form an important part of the Intelligent Transport Systems (ITS) architecture. With the travelling time being given more priority for routing, often the emissions and the air pollution data is not included. With the rising pollution and an increase in the volume of vehicles and traffic, it is necessary to devise a system where these parameters are taken into account. The objective of the work is to provide a route with minimal pollution using an air pollution based routing algorithm. The proposed algorithm identifies the Air Quality Index (AQI) of the streets and provides the route with the lowest mean AQI to the vehicle. The algorithm was simulated on a realistic map of a region of Chennai with vehicular traffic using OMNeT++ and SUMO as a VANET network simulator with Veins framework. The performance of the algorithm was analyzed by monitoring the parameters like mean AQI, total travel time and the distance travelled by the vehicle for a specific set of ten vehicles throughout their journey from its source to the destination location.
Introduction
Air pollution is considered to be one of the most dangerous types of pollution. Breathing polluted air and living in a highly polluted zone can be called as a health hazard for public. Air pollution is said to be one of the most dangerous health risks worldwide [1]. Based on a study done by Scientists from the Max Planck Institute for Chemistry and the University Medical Center Mainz, the public loss in life expectancy due to air pollution is higher compared to loss of life due to other risk factors like smoking, violence or infectious disease. According to the study, air pollution is the cause for close to two thirds of deaths. Around 5.5 million deaths a year can be avoided and the major contribution to polluted air is the use of fossil fuels. A similar conclusion is drawn by the findings in the State of Global Air Report 2019 that air pollution is the fifth leading risk factor leaving behind other better known risk factors like alcohol consumption or malnutrition. In simpler words, more people die due to air pollution related disease than malaria or road accidents every year.
The State of the Global Air 2019 report says that air pollution is caused by three of the most problematic pollutants: fine particles (PM2.5), ozone and household (indoor) air pollution. It was compiled and released by the US-based Health Effects Institute (HEI). Over 90 percent of people worldwide live in areas with unhealthy levels of air pollutants as per guidelines set by the World Health Organization as per the report.
Even our country suffers the same plight and based on the report by the Global Alliance on Health and Pollution (GAHP) 2019, India leads worldwide in the case of air pollution related deaths. “India has seen increasing industrial and vehicular pollution from urban growth while poor sanitation and contaminated indoor air persist in low-income communities,” the report said. Air pollution is one of the leading threats to public health, especially children. Children less than 5 years die due to breathing polluted air according to WHO [2].
A way of understanding about the condition or quality of air in a given area a system of rating the safety of air in a given area called the Air Quality Index (AQI). The AQI is a tool that indicates the quality of air and converts complex air quality data into a single number or colour. A higher AQI of a given area indicates low quality of air which is unsafe and can cause health hazards. AQI measurement is based on eight pollutants namely - Particulate Matter (size less than 10 μm) or (PM10); Particulate Matter (size less than 2.5 μm) or (PM2.5); Nitrogen Dioxide (NO2); Sulphur Dioxide (SO2); Carbon Monoxide (CO); Ozone (O3); Ammonia (NH3) and Lead (Pb).Thus AQI has great significance as it reflects the air pollution and if the purpose is to reduce pollution of air it can be equivalent to reducing AQI value. One means of reducing AQI is by reducing vehicular pollution which as mentioned, is a major contributor of air pollution. Vehicle emissions have become a dominant source of air pollutants, including carbon monoxide (CO), carbon dioxide (CO2), volatile organic compounds (VOCs) or hydrocarbons (HCs), nitrogen oxides (NOx), and particulate matter (PM) in a lot of areas. With an increase in population and number of vehicles, there is a rise in pollution levels, fuel consumption and traffic congestion. This combination of rising greenhouse gases and congestion of traffic is causing the deterioration of air quality in urban areas.
Given the problems associated fuel consumed, air quality and traffic congestion, the solutions to tackle it are as follows: i) To increase the size of roads/streets and number of highways as it will lead to better handling capacity of increasing vehicles. ii) Switch to alternate means of transport that utilize less resources. iii) To make use of current road capacity in urban areas efficiently. For proper management of traffic, option (i) cannot be implemented practically as building new infrastructure over a large scale is not feasible. Though option (ii) seems favourable, it is difficult to implement it. Thus, we are left with option (iii) i.e efficient use of preexisting systems to manage traffic. But, current technologies have drawbacks such as high delay and low details of traffic information. With current developments in the field of wireless communication, in near future vehicle to vehicle and vehicle to infrastructure (V2X) based communication will enable proper traffic management on a wider scale. VANET is one such system.
VANET stands for Vehicular Ad-Hoc Network. It is a form of Mobile AdHoc Network that provides communication between vehicles (V2V) and vehicle and infrastructure (V2I). This V2X systems have several applications in Intelligent Transportation Systems and helps in making them more efficient. In VANET based networks, the routing is done dynamically. Thus, the choice of routing protocol and its parameters play a very important role on how the system will behave. In general, the shortest path algorithms are implemented to provide the best route which reduces traffic congestion and saves resources. This is achieved by choosing the travelling time as the cost function for the algorithm. In order to provide with the least polluted route, we take the pollution data as the cost function. Thus, the best route with minimal pollution is provided.
Related Works
H. Noori and M. Valkama [3] discussed about providing the fastest route from origin to destination by using the V2X (V2V or V2I) communication which provides real-time traffic information. The authors used current travelling time calculated by the Road Side Units (RSUs) which is provided to traffic information center assigned to each street. These centers are responsible for providing the best route using A* search algorithm. This task was accomplished by employing SUMO, OMNeT++ and Veins to run simulations of a realistic large scale city with real traffic demand using a network simulator as a VANET scenario. The authors depicted that the traveling time was decreased on an average of about 52% and fuel consumption was reduced on and average of about 48%.
B. Vamshi and R. V. Prasad [4] proposed a framework based on Internet of Things (IoT) architecture to reduce the amount of air pollution and time of exposure to the commuters. Yen’s algorithm along with modifications is used to compute a number of routes between the source and destination pair. A cost function based approach which is dependent on the factors like traffic junction congestion and the length of the roads connected to the junction is used and the route with minimal cost function value is voted as the route with less pollution exposure and sub optimal shorter distance according to the algorithm. Output visualization was presented using Django framework where the final routes are displayed with the help of Google maps API and JavaScript. The authors depicted the increase in distance in avoiding the crowded junctions was approximately 2.3% compared to the Google routing strategies for the given test case scenario.
A. H. Khosroshahi et. al. [5] devised a scheme for acquiring real-time traffic information on inter urban routes based on VANET networks, Inter Vehicle Communication (IVC) and Vehicle road-side device communication (VRC). The authors considered parameters like travel time, expire time, delay at intersections, fuel consumption, class of road segment and uncertainty but air pollution information in each of the roads which is an important factor was not taken into consideration. The cost function used has weights assigned for each of the parameter so they can be varied to give more importance to certain parameter.
R. Doolan and G. Muntean [6] developed the algorithm, EcoTrec, which aims at reducing the greenhouse gas emissions from the vehicles by reducing fuel consumption. The factors utilized by the authors in the algorithm are the road and traffic conditions which are obtained using on board sensors and communicated through VANET. This algorithm does not provide a minimum pollution route. In the low vehicle density scenarios, vehicle to vehicle communication is difficult, the algorithm performed poorly due to false positive readings of traffic congestion.
Problem Statement
With perpetual increase in concentration of vehicles and in turn traffic volume and congestion and also with improvements in the ability to communicate wirelessly, VANET is an apt platform to enable better and eco-friendly commuting. So, to help in tackling air pollution, this paper proposes a new method to find the route with the least AQI and provides this real-time to the drivers. This method assigns an AQI for every street in the city and finds the best route in terms of lowest exposure to harmful air pollutants. The efficiency of the developed algorithm which is used to identify the route with the lowest air pollution is analysed in a realistic traffic simulation. The algorithm uses SUMO to simulate a microscopic traffic, that is, by considering the movement of every single vehicle and also by dynamically planning the route of the vehicles as the AQI of the streets changes with passing time.
Methodology
Air pollution is seen as one of the dangerous types of pollution. The increasing number of vehicles and industries due to population growth and industrialization has led to the air quality being very poor. Air Quality Index is the term used to measure the quality of air of a given location. The higher the value of AQI, the greater is the level of air pollution which leads to a greater concern regarding health. Generally, an AQI of values below 100 is considered satisfactory while when the values above 100, the air quality is said to be unhealthy especially for sensitive people. The five major air pollutants that contribute to low air quality are ground-level ozone, particulate matter, carbon monoxide, sulphur dioxide and nitrogen dioxide. This paper proposes an algorithm to find an optimum route with the least mean AQI which is provided to the drivers to ensure that they are exposed to less air pollution. This section is divided to two parts: First, the algorithm to find the optimum route is elaborated. Second, the VANET simulation scenario is discussed where Veins framework is used to run OMNeT++ and SUMO in parallel.
Air Pollution Based Routing Algorithm
There are several approaches to identify the best route for vehicles. Some have modified this so that the route dynamically alters based on conditions like traffic congestion, road blockage, etc. which changes constantly. This search for the best route is a classic shortest path problem. The most commonly used algorithms to solve such shortest path problems are Dijkstra or A* [7]. A graph consists of several edges and vertices. A road segment or street is seen as a set of links and the intersections are defined as vertices. In a digraph, each link has a direction, that is, for example if M and N are two points which are connected to each other by a street, then there are two different links present in the defined street. The link MN which shows the traffic flow from the point M to the point N while the link NM defines the traffic flow from the point N to the point M in the other direction. In addition, each link can carry a cost or weight which can be travel time, vehicle emissions, fuel consumption, AQI, etc.
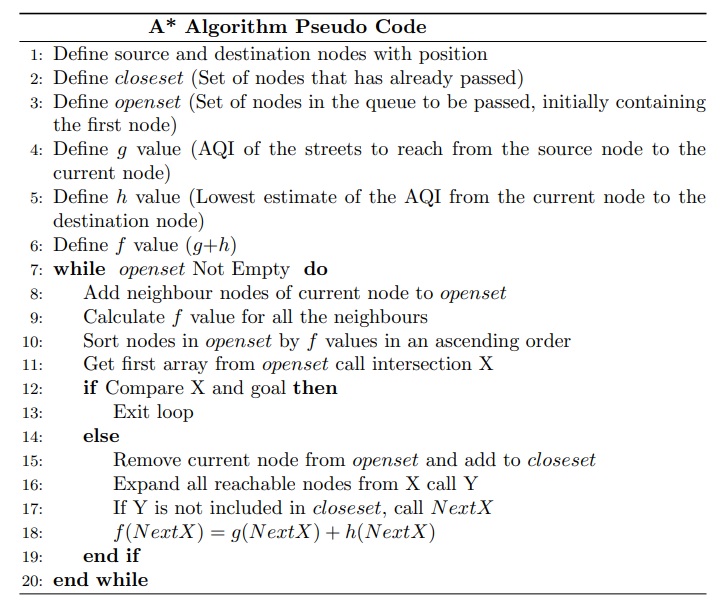
This paper implements the A* search algorithm for identifying and calculating the best route, that is, the route with the best air quality. The A* search algorithm is a popular search algorithm that uses a combination of uniform cost search and greedy search to calculate the end result. Hence, it is an optimal and a preferred search method [8]. A* search algorithm considers a sum of two functions, g(n), the cost (or weight) to reach from the source node to the current node (node n), and h(n), the cost (or weight) to reach from the current node n to the destination node. Therefore, f(n), the cost function for the node n is the least cost path from the given source node to the destination node via the node n. The flow of the A* search algorithm can be elaborated as follows: The A* search algorithm defines two different sets, namely the Open and Close set. Starting with the source node, the algorithm maintains the openset as the priority queue of intermediate nodes which should be traversed through to reach the destination node. The highest priority is given to the f(x) value which is the lowest for the node x. At every iteration of the algorithm, the node x which has the lowest f(x) value is removed from the openset (priority queue) and is added to the closeset. Subsequently, the neighbours of node x are added to the openset and the h(n), g(n) and f(n) values of these neighbours are also calculated and updated accordingly. The final iteration of the algorithm is when the algorithm finds the destination node in the priority queue with the lowest f(x) value in the openset (or till the openset gets empty). The weight or cost of the shortest path is equal to the f(x) value where x is the destination node and the shortest route is identified by going through the traversed path.
In [3], the traveling time is used as the cost function to reduce the travel time of the journey. This paper uses the AQI of a given road or street as the cost function as the main aim is to provide the driver with a route with the best quality of air hence reducing the exposure to harmful air pollutants. The method used is shown in Algorithm 1.
Simulation Scenario
To control the traffic simulation, the paper developed a program written in C++ on OMNeT++ capable to connect to SUMO using the Veins framework. This program can assign AQI values for every street in the map used for simulation based on the data obtained from the Tamil Nadu Pollution Control Board [9]. It also can find the optimum route for the vehicles using the A* search algorithm which uses the assigned AQI as the cost for calculating the least polluted route. Moreover, several statistics related to traffic simulation are created such as traveling time, emissions for each car, number of vehicles during simulation, total distance travelled by the vehicles, etc.
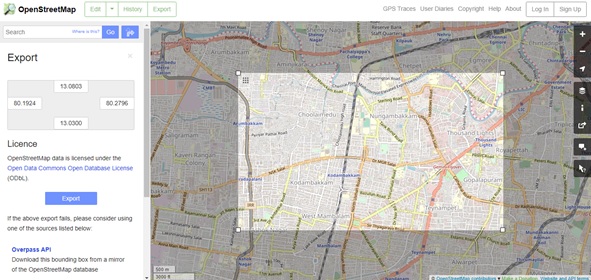
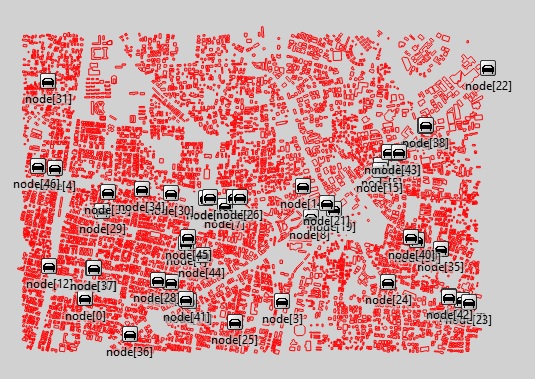
In order to perform and obtain realistic and reliable results for evaluation, this work uses realistic traffic and map data for the simulation. For the traffic demand and network of roads and streets, a data set of a part of Chennai consisting of Kodambakkam, Choolaimedu and Nungambakkam was obtained from OpenStreetMap (OSM) and has been used for a realistic simulation.
In the project, SUMO (traffic simulator) along withOMNeT++, integrated using Veins framework, is employed to simulate the air pollution based routing using A* search algorithm. It is investigated in the ideal form, that is, without any wireless communications technique to properly analyze the efficacy of the algorithm alone. In order to investigate the effect of the algorithm and its effect on the route changing, initially, a set of vehicles are simulated to mimic realistic traffic in the area and then, 10 vehicles are released from different sources, one by one, with each vehicle having its own destination. They were monitored until all the 10 vehicles reached its specified destination.
To figure out the effect of the A* search algorithm based routing using the AQI of the different streets, two different simulations were done as follows:
- First, the 10 vehicles were given fixed routes initially which were obtained using the travel time as cost. At no point in the simulation were the routes changed in this case.
- In the second simulation, the 10 vehicles were given routes based on the A* algorithm which used the AQI of the streets as the cost. Here, the routes were allowed to change dynamically based on the AQI of the route throughout the course of the simulation. The changing route for all the vehicles were constantly recorded for analysis.
Results and Discussions
To evaluate the performance of the air pollution based routing algorithm, the paper considered multiple parameters namely, Air Quality Index, travel time of the vehicle and the distance travelled. These parameters were specifically chosen to keeping the driver of the vehicle in consideration. The AQI makes sure that the route chosen has the best quality of air compared to the other available routes. Travel time and distance travelled were also considered as the identified low air pollution route must have a good trade-off between the parameters and must not make the journey too long and tedious for the driver. This section discusses each of the simulation parameters considered for performance evaluation in the simulation.
Mean Air Quality Index (AQI)
The Air Quality Index is the measure of the quality of air for a given location. This is specified with a number or a colour. The lower this number, the better is the quality of air. Generally a value of over a 150 is hazardous for the public while a value above 100 causes health problems for the sensitive group of people. In the simulation, each of the streets have a value of AQI associated with it and the algorithm calculates a route with the lowest air pollution in terms of a low mean value for the entire journey.
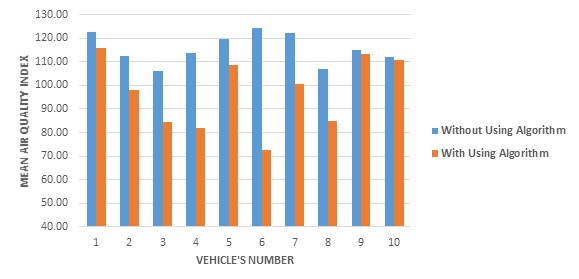
Figure depicts the mean AQI for the 10 vehicles as seen in the two simulation scenarios. These results can vary with the general air quality pattern of a location. The average decrease seen between the two scenarios is quite high and hence these results are acceptable. It can be seen that in all of the cases the new route has a lower mean AQI. An average reduction of 18 units in mean AQI is observed.
Distance Travelled
The total distance travelled by the vehicle is the total distance between the vehicle’s source and destination location. This mainly depends on the route taken by the vehicle.
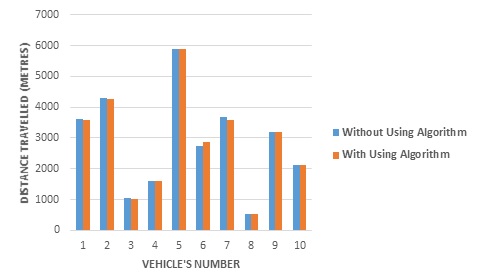
It can be concluded from Figure which compares the distance travelled by the vehicles in the different scenarios that the values with and without using the algorithm are almost the same. These results are seen as acceptable as the absolute difference between the two values is very less and is hence considered as negligible.
Total Travel Time
The total travel time of the vehicle is the total time taken for the vehicle to go from the specified source to destination. This includes all the delay caused due to any kind of interference in the journey like traffic congestion, etc. It is obtained for all the 10 vehicles monitored.
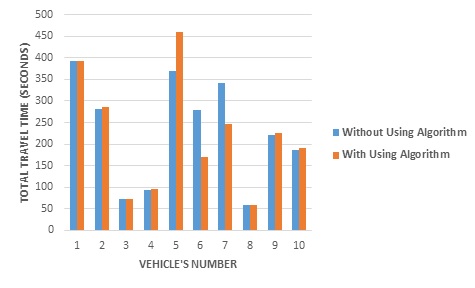
It can be inferred that there is mostly a very small increase and occasionally a decrease in the total travel time when compared the case where the algorithm is not used. This increase can be considered as an acceptable trade-off as the increase in travel time results in a very good decrease in the mean AQI as observed in the vehicle 5.
Conclusions
Air pollution is known to be one of the most dangerous types of pollution and exposure to such polluted air can cause health hazards to the general public. The paper proposes a VANET based routing algorithm which calculates and presents the driver with a route with the best air quality. The simulation of the algorithm is done with the help of a network simulator, OMNeT++ and a mobility simulator, SUMO which are integrated using the Traci package of the Veins framework. The TraCI package uses a TCP client/ server based connection to monitor and control the vehicles in SUMO from OMNeT++. A region of Chennai consisting of Kodambakkam, Choolaimedu and Numgambakkam was taken to provide a realistic road network for the simulation and the real-time AQI data of the location was taken from the Tamil Nadu Pollution Control Board [9]. The simulation was performed for two scenarios, that is, with and without implementing the air pollution based routing algorithm. A total of 10 vehicles were monitored in the simulation. The parameters used to analyse the algorithm were the mean AQI, total travel time and the total distance travelled by the vehicle. The mean AQI was significantly lower in the vehicles when the algorithm was implemented. A good trade-off between the travel time and mean AQI was established, that is, in the case where the total travel time was a little higher, the mean AQI was significantly lower than its counterpart. The total distance travelled by the vehicles were almost similar for both the cases. This proves that the algorithm maintains a good balance by providing a route with low air pollution and at the same time keeping into consideration the other factors like total travel time and total distance travelled by the vehicle.
References
[1] ”Air pollution is one of the world’s most dangerous health risks”, ScienceDaily, 2020. [Online]. Available: https://www.sciencedaily.com/releases/2020/03/200305135048.htm. [Accessed: 04- May- 2020]
[2] ”[Report] About 93% Of Children Get Affected by Toxic Air”, AQI India, 2020. [Online]. Available: https://www.aqi.in/blog/report-about- 93-of-children-who-are-below-the-age-of-15-get-affected-by-toxic-air/. [Accessed: 04- May- 2020]
[3] H. Noori and M. Valkama, ”Impact of VANET-based V2X communication using IEEE 802.11p on reducing vehicles traveling time in realistic large scale urban area,” 2013 International Conference on Connected Vehicles and Expo (ICCVE), Las Vegas, NV, 2013, pp. 654-661, doi: 10.1109/ICCVE.2013.6799873.
[4] B. Vamshi and R. V. Prasad, ”Dynamic route planning framework for minimal air pollution exposure in urban road transportation systems,” 2018 IEEE 4th World Forum on Internet of Things (WF-IoT), Singapore, 2018, pp. 540-545, doi: 10.1109/WF-IoT.2018.8355209.
[5] A. H. Khosroshahi, P. Keshavarzi, Z. D. KoozehKanani and J. Sobhi, ”Acquiring real time traffic information using VANET and dynamic route guidance,” 2011 IEEE 2nd International Conference on Computing, Control and Industrial Engineering, Wuhan, 2011, pp. 9-13, doi: 10.1109/CCIENG.2011.6007944.
[6] R. Doolan and G. Muntean, ”EcoTrec—A Novel VANET-Based Approach to Reducing Vehicle Emissions,” in IEEE Transactions on Intelligent Transportation Systems, vol. 18, no. 3, pp. 608-620, March 2017, doi: 10.1109/TITS.2016.2585925.
[7] S. Shaw and H. J. Miller, Geographic Information Systems for Transportation: Principles and Applications. New York: Oxford University Press, 2001, p. 458.
[8] P. Norvig and S. J. Russell, Artificial intelligence: A modern approach. New Jersey: Prentice-Hall, 1995.
[9] Tamil Nadu Pollution Control Board, 2020. [Online]. Available: https://www.tnpcb.gov.in/air-quality.php. [Accessed: 21- Mar- 2020]